Visualizations

A Simple Cup

April 22nd, 2009

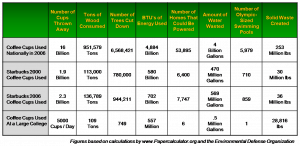
Visualizing the impact a simple cup can have on our environment

According to sustainabilityissexy.com, over 6.5 million trees are consumed each year to produce the 16 billion disposable coffee cups that are being thrown away out into landfills. For about every 50,000 paper coffee cups produced, a tree is destroyed. Read more »
Data Visualizations from the Museum of Natural History

March 24th, 2009
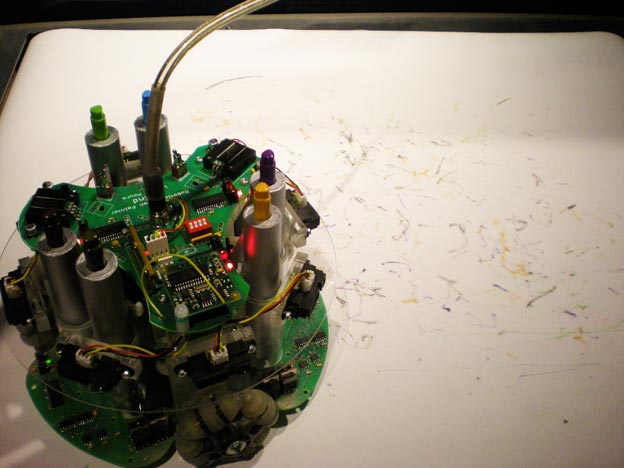
RAP (Robot Action Painter) - creates original paintings using a combination of random decisions and responses to its environment

RAP (Robot Action Painter) - creates original paintings using a combination of random decisions and responses to its environment

Last week I visited the Museum of Natural History in New York City and was amazed with all the data visualizations they put together for their displays. Ever since my visit to the museum, I have become addicted to designing my own data visualizations for different types of data sets. Click here to view some of the visualizations I photographed during my journey through the Museum of Natural History.

View the visualizations »

Jaw-Dropping Statistics

February 2nd, 2009

For inspiration to help develop an idea for a semester long project, my Mainstreaming Information class was asked to present three examples of “jaw-dropping” statistics that highlight a particularly surprising situation or trend. I think much can be said about the following shocking data that affect our planet both environmentally and socially:

The Basic Problem with Coffee Cups

(more…)